In Google Analytics 4 (GA4), a Tech report provides information about the technical aspects of how users interact with your website or app. This includes details such as the devices, browsers, operating systems, and network properties used by your visitors.
Understanding the tech report can help you optimize your website or app for different devices and platforms, ensuring a smooth user experience across various environments. It can also provide insights into any technical issues that may be affecting your site’s performance on specific devices or browsers.
By analyzing the data in the tech report, you can make informed decisions about your digital strategy, such as prioritizing development efforts for certain devices or optimizing your site’s compatibility with popular browsers and operating systems.
How Do I Access The Tech Report?
To access the tech report in Google Analytics 4, follow these steps:
1. Under “User,” click “Tech.”

2. You can then select “Overview” to see a comprehensive overview of your user’s operating system, platform, and other key elements. You can also choose “Tech details” to see a breakdown by browser.
How to Read and Customize The Tech Report
In the Tech section of GA4, you can view a lot of critical information about your users. Let’s break it down by Overview and Tech details, the two main categories.
Overview

When you select “Overview,” you’ll notice a few important things right away. First, you’ll see what platform your visitors are using in a pie chart. You’ll also see a graph of your users over the past 30 minutes and the option to view this information in a real time report.
When you scroll down, you’ll be able to dig into your user’s operating system and their platform/device category (Ex. Web/mobile). You’ll also see the browsers your users prefer and the device category (Ex. desktop, mobile, and tablet). Scrolling further lets you see even more details, including screen resolution, app version, and device model.
Tech Details
When you click on “Tech details,” you’ll first be greeted by a chart that shows users by browser over time.
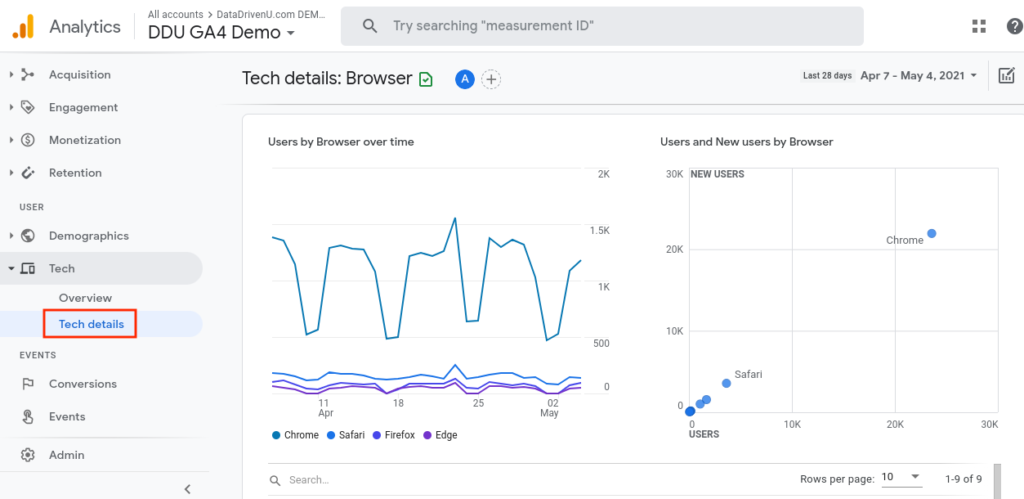
You’ll also notice a breakdown of users and new users by browser. Scrolling further will allow you to view more of your user’s browser data. You’ll see important details here, like engaged sessions and engagement rate.
You can also add a comparison in the “Overview” or “Tech details” section to customize your tech report. Just click the “Add comparison” button at the top.

Then, simply include the dimensions you want to view in your tech report. For example, you might have launched a remarketing campaign aimed at users from a particular area. Here, you can choose “city” or “country” from the dimensions drop-down menu to see those users alongside the rest of your tech report. Simply click “apply” when you’re ready to see this comparison integrated into your tech report.
